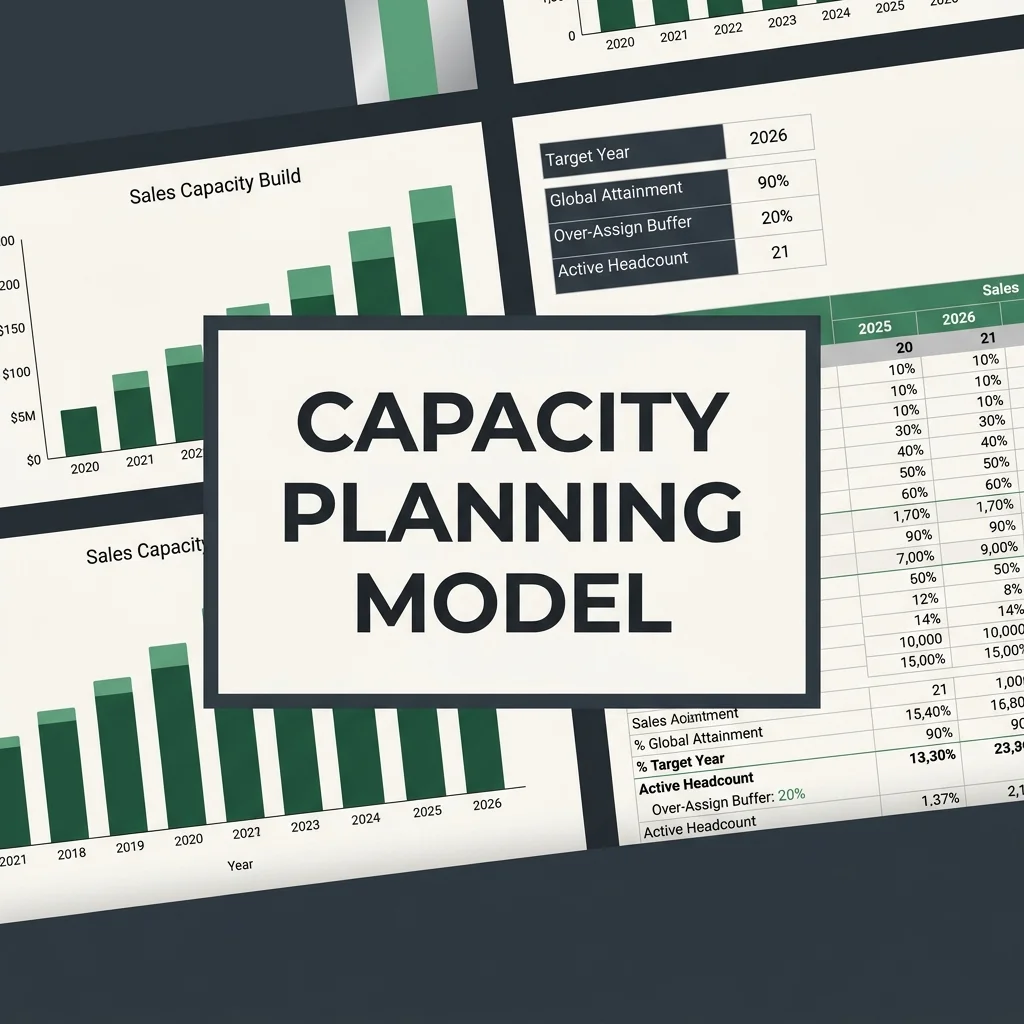
Most capacity models are built to answer one question: how many reps do we need to hit the number? That's not a bad question. It's just not nearly enough.
The model I use is designed to do three jobs. It sets the annual plan. It then runs as a live operating tool every month after that — same model, same structure, no rebuilding. And when the business moves in a direction you didn't plan for, it lets you run scenarios fast enough to course-correct before a Q2 problem becomes a Q4 disaster.
That last part is what most models can't do. They're built once, used for the board deck, and then slowly become wrong. This one gets more accurate every month and lets you steer in real time.
When CRM actuals come in, they replace forecasts automatically based on a single cutoff date. The team stops spending close week wrestling with the plumbing and starts spending it on the business — understanding why performance is where it is, not reconciling data into a format the model can accept.
That shift — from model-maintenance to analysis — is the whole point.
What goes in
Four things feed the model:
The problem most models have — and how I solved it
Add a new product tier. Extend the timeline from three years to five. Change your segment definitions mid-year.
In a typical model, any of these means a few days of formula rewrites, a few opportunities to introduce errors, and a model that looks slightly different from last month's version in ways nobody can fully explain.
I built this one so that it retrieves data by identity — "Enterprise Tier," "SMB," "APAC" — rather than by cell address. Adding a new tier means adding a row to the schema. The formulas don't change. The formatting adjusts automatically.
The model from month one still looks and works exactly the same in month eighteen.
This matters more than it sounds. The maintenance overhead — the quiet tax analysts pay every month-end just to keep a template working — is where most of the analytical capacity in a finance team quietly disappears.
Timing is everything: the ramp-seasonality problem
A rep who joins in September and takes four months to ramp is contributing almost nothing to Q4. Depending on your seasonality, that's either fine or a serious miss — and the difference is in how you plan the hiring batches, not just the headcount number.
The model is built around ramp-lag synchronization: aligning when classes of reps are hired so they hit full productivity exactly when the business needs them most. Every market has its own version of this problem. In the Middle East, you're planning around Ramadan. In Europe, the summer slowdown. In the US, Q4 compression followed by a January reset. The model handles all of it natively — not as manual adjustments someone remembers to make, but baked into the seasonality logic from the start.
There's a marketing dimension here too that most capacity models ignore entirely. If your sales class ramps in Q2 but marketing's lead-gen pipeline for Q2 was sized for the team you had in Q1, you're going to have expensive reps with empty pipelines.
The model surfaces that misalignment before it becomes a Q2 problem.
Running scenarios live
The question I get asked most often in board meetings isn't "what's the base case." It's "what happens if."
What if we cut time-to-productivity by 20%? What if enterprise attrition runs hot for two quarters? What if we delay the next hiring batch by six weeks?
The model can answer any of these in real time — toggle a variable, see the output cascade through ramped capacity, the commitment delta, and the P&L. No follow-up email. No "let me check and come back to you."
The commitment delta itself is worth explaining: it's the gap between what sales is chasing (the street target) and what you've promised the board. That gap needs to be intentional and visible. A model that buries it is doing you a disservice.
On the outputs
I'm fairly opinionated about how financial models should look. Not because aesthetics matter for their own sake, but because a model that's hard to read produces decisions that get made on misread data.
The visual logic I use: historical periods are shaded so it's immediately clear they're locked. The forecast zone stays white — that's where active thinking happens. Quarter and year boundaries get explicit whitespace so the eye can tell the difference between "how did Q3 go" and "what's the annual shape of the plan" without hunting for it.
A board member or CFO picking up this model for the first time should be able to orient themselves in about thirty seconds. That's the bar I build to.
The model and a full user guide are linked above.
If you're building something similar, or inheriting a model that breaks every time the business changes, I'd genuinely like to hear what you're running into.